Home Improvement Costs Rose 76.1% in a Decade as Older Homes Require More Upkeep
Median project costs reached $2,113 in 2025 dollars. Older homes face higher annual upkeep, while homeowners paid for most projects with savings.

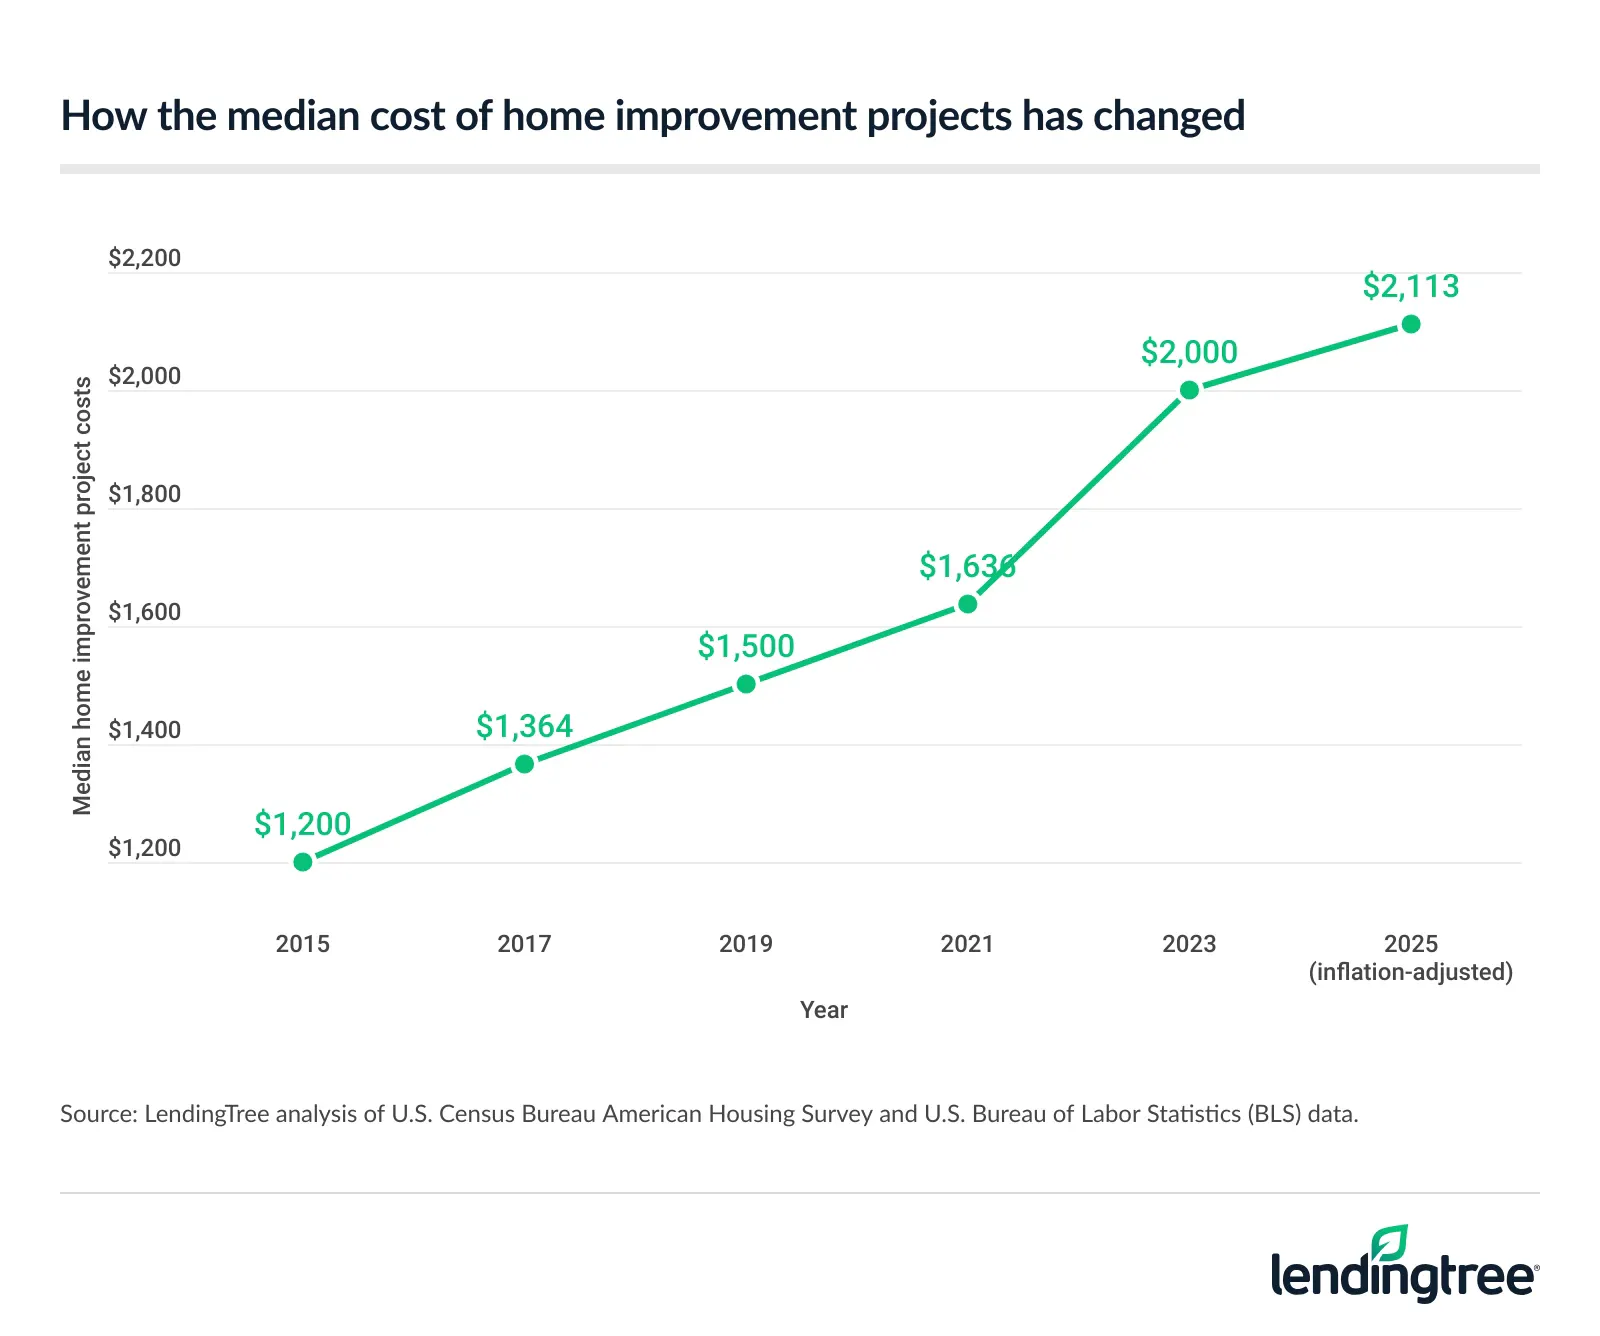
The rising cost of home projects is changing the upkeep budget for homeowners. From 2015 to 2025, the median project cost increased 76.1%, reaching $2,113 in 2025 dollars. At the same time, routine maintenance costs run higher for older homes, and improvement work is common: 51.6 million owner-occupied homes reported projects during the survey’s two-year reference period.

The figures point to a steady cost of ownership beyond mortgage payments. Labor and building supplies may explain part of the increase, while homeowners who stay put may be choosing larger upgrades instead of moving. The data also show how households handle the expense: savings funded most projects, while larger jobs were more often associated with borrowing or insurance settlements.
Project costs climbed fastest from 2021 to 2023
The median cost of a home improvement project rose from $1,200 in 2015 to $2,113 in 2025 dollars, a 76.1% increase. The steepest period in the series came between 2021 and 2023, when the median rose 22.2%.
Matt Schulz, LendingTree chief consumer finance analyst and author of “Ask Questions, Save Money, Make More: How to Take Control of Your Financial Life,” attributes the increase partly to labor and materials costs. He also points to a shift in what homeowners choose to do: people reluctant to move amid high mortgage rates may be spending more on their current properties.
Project type and who does the work make a substantial difference to the median. Professionals completed 64.1% of projects, with an estimated median cost of $4,103. DIY work accounted for 35.9% and had a median cost of $845. Across all projects, the median was $2,113.
That gap doesn’t mean labor alone accounts for the difference. More complex and expensive tasks, including roof replacements, are more likely to require professional expertise, which lifts the median for professionally completed work. DIY projects, by contrast, may include more modest jobs.
Project costs: professional versus DIY
| Project type | Project share | Estimated median ($) |
|---|---|---|
| Total | – | $2,113 |
| Professional | 64.1% | $4,103 |
| Do-it-yourself (DIY) | 35.9% | $845 |
Source: LendingTree analysis of U.S. Census Bureau American Housing Survey and U.S. Bureau of Labor Statistics (BLS) data.
Age of the home changes the upkeep bill
Routine maintenance for owner-occupied homes costs an estimated $1,433 a year on average. For homes built before 1940, the estimate rises to $1,706 annually. At the other end of the age range, homes built from 2022 to 2023 averaged $173 in maintenance costs.
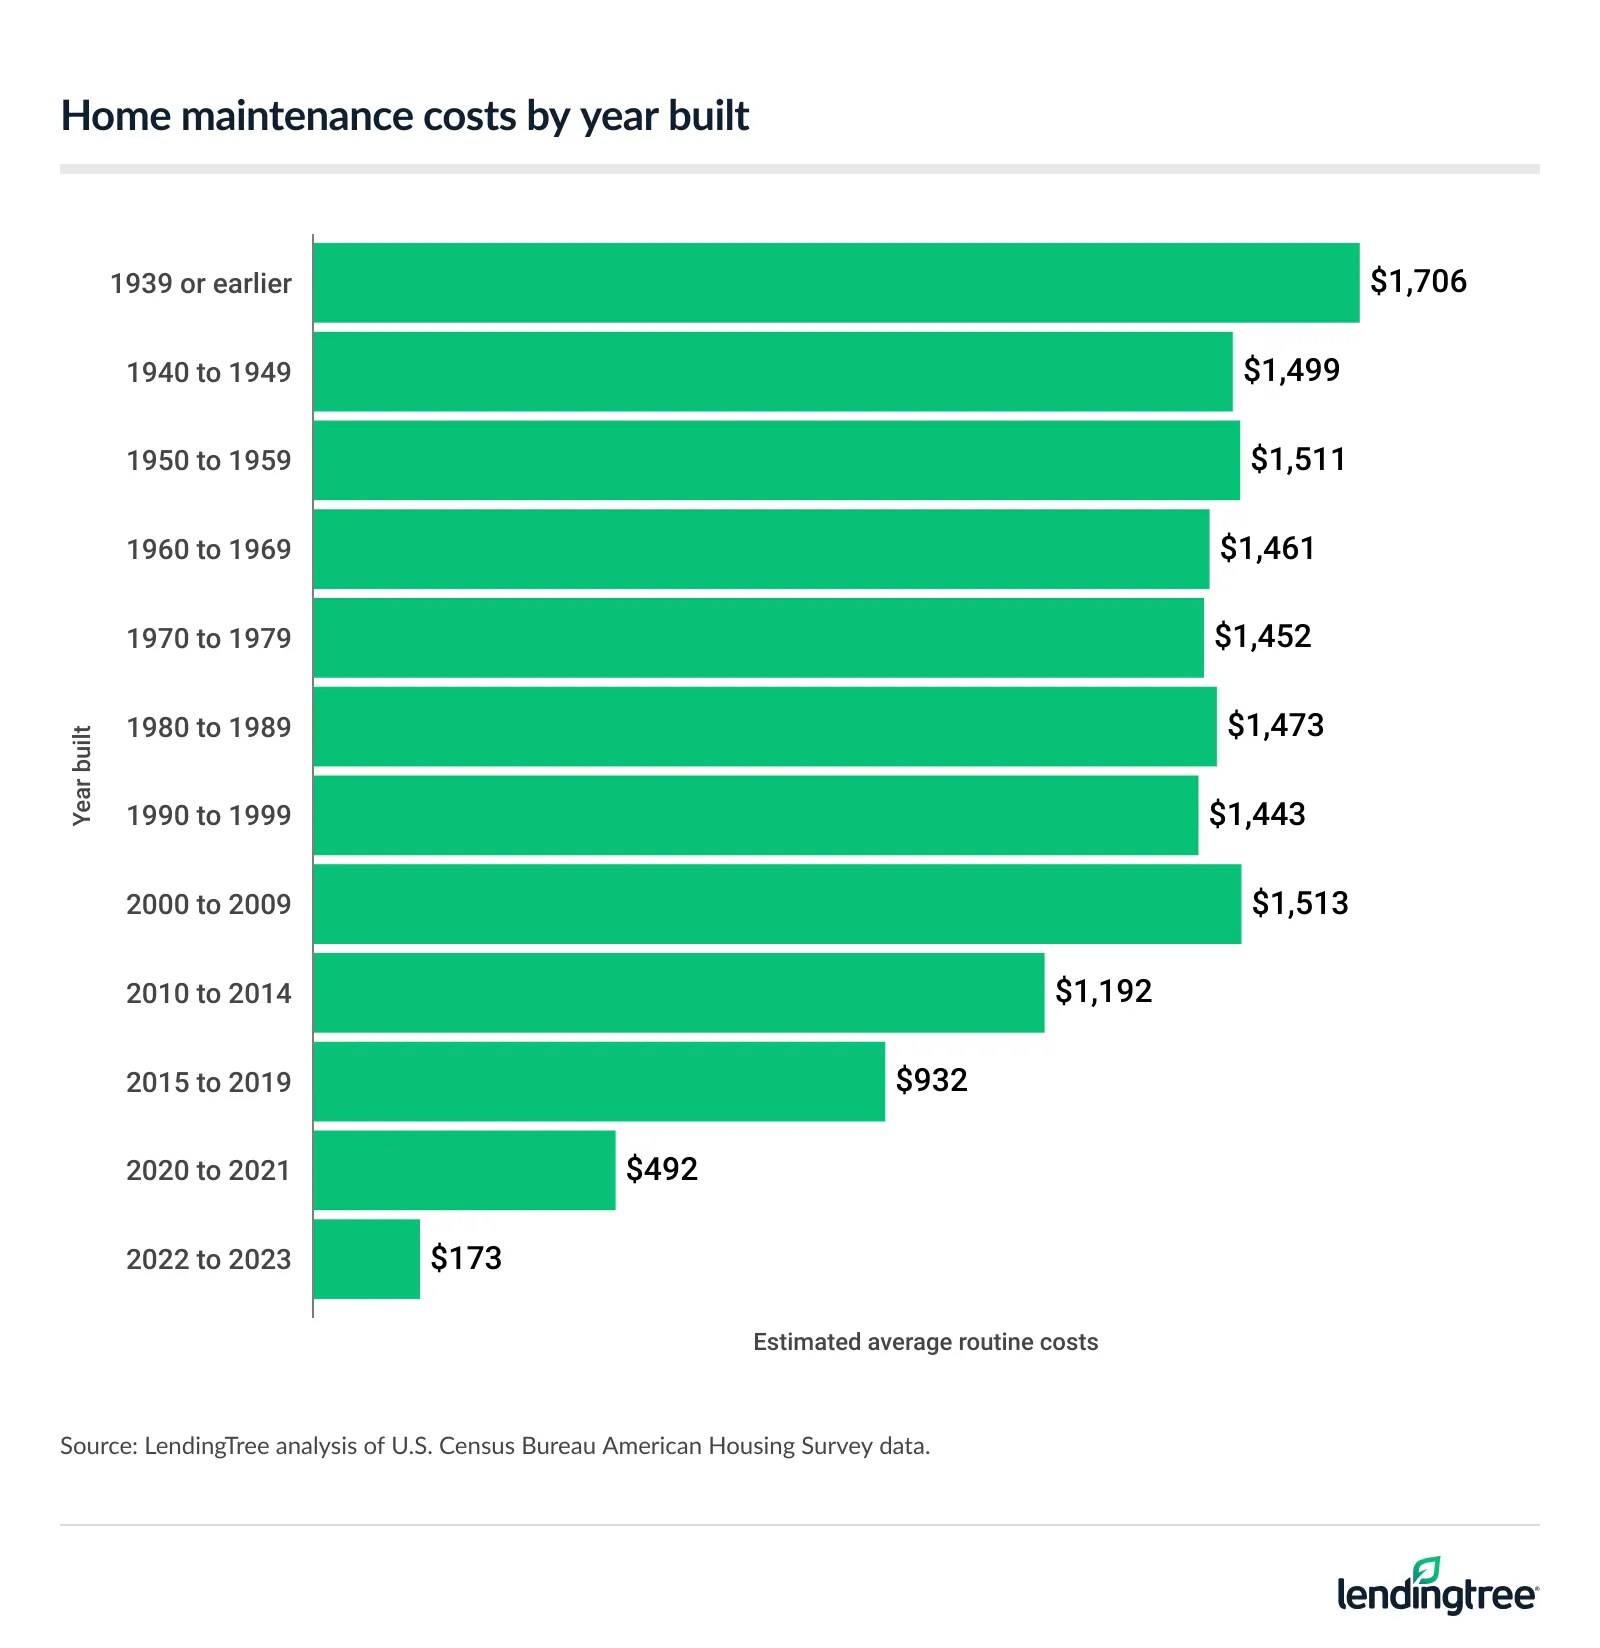
The contrast highlights how purchase price and ongoing expenses can tell different stories. A property’s age may bring more frequent repairs, and a single major defect can strain a household budget. Schulz advises prospective buyers to inspect the roof, foundation, drainage, plumbing, electrical system and HVAC, along with looking for signs of water damage. Reviewing seller disclosures and asking follow-up questions can also help surface potential costs before purchase.

For current owners, the annual estimates are a reminder that maintenance needs can vary widely from one property to another. An average offers a useful reference, but it won’t capture the timing of a large repair or the condition of a particular home.
Improvements touch most owner-occupied homes
During the survey’s two-year reference period, 51.6 million of 86.9 million owner-occupied homes had at least one improvement. Those households reported 139.9 million projects, an average of 2.7 projects per home that had work done.
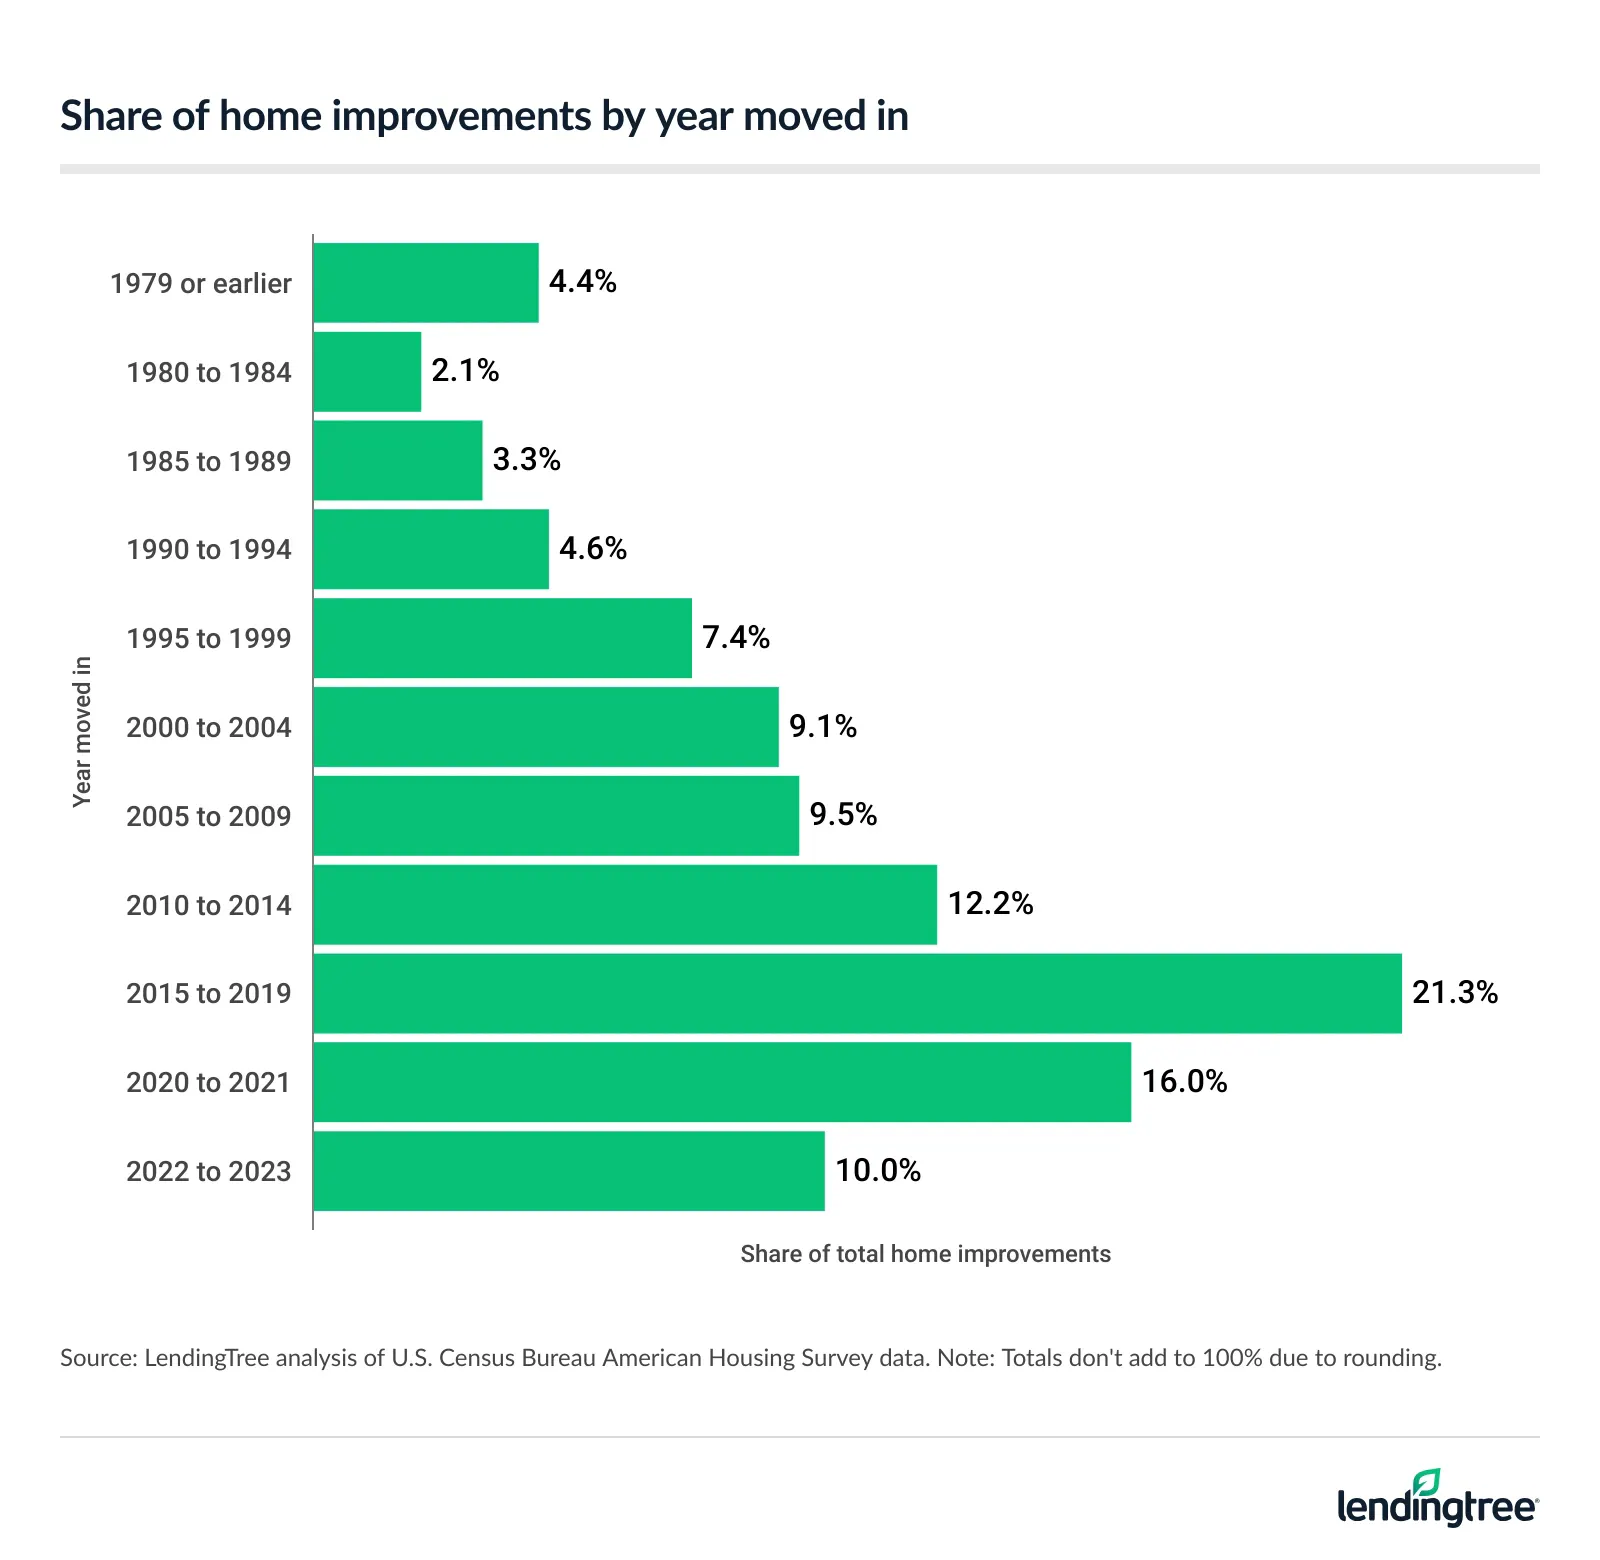
Recent buyers made up a large share of the activity. Homeowners who moved in after 2014 completed 47.3% of all projects. Those who moved in between 2015 and 2019 accounted for 21.3%, the largest share among the move-in periods reported.
The most common category combined additions or replacements of water heaters, dishwashers and garbage disposals. It represented 11.7% of tracked projects and had a median cost of $845. Plumbing fixtures, at $573, and security systems, at $453, were the only categories cited as less expensive.
Other frequent work ranged from HVAC replacements to flooring, roofing and bathroom remodeling. The shares below show how project activity was distributed across the ten most common categories.
Most common home improvement projects
| Project | % of projects |
|---|---|
| Water heater, dishwasher or garbage disposal addition or replacement | 11.7% |
| HVAC installation or replacement | 9.1% |
| Flooring, carpeting, paneling or ceiling tiles addition or replacement | 7.8% |
| Plumbing fixtures addition or replacement | 7.1% |
| Roofing repair or replacement | 5.9% |
| Windows or doors addition or replacement | 5.6% |
| Bathroom remodeling | 5.3% |
| Landscaping or sprinkler system addition or replacement | 5.0% |
| Security system installation | 5.0% |
| Electrical wiring, fuse boxes or breaker switches addition or replacement | 4.7% |
Source: LendingTree analysis of U.S. Census Bureau American Housing Survey data. Note: Only the 10 projects with the highest share are included.
Schulz’s broader point is that repairs and upgrades can accumulate, and some work cannot be deferred indefinitely. A damaged roof or failed HVAC system may require prompt attention. Households that don’t set aside money for upkeep may have fewer options when an urgent repair arrives, including turning to high-interest credit.
Savings funded three-quarters of projects
Cash savings paid for 75.7% of home improvement projects. Credit cards or retail store charge cards covered 6.3%, and homeowners insurance settlements funded 3.9%. The median cost varied considerably by source: $1,902 for projects paid from savings, $7,924 for those funded by home equity loans, and $9,963 for projects paid through insurance settlements.
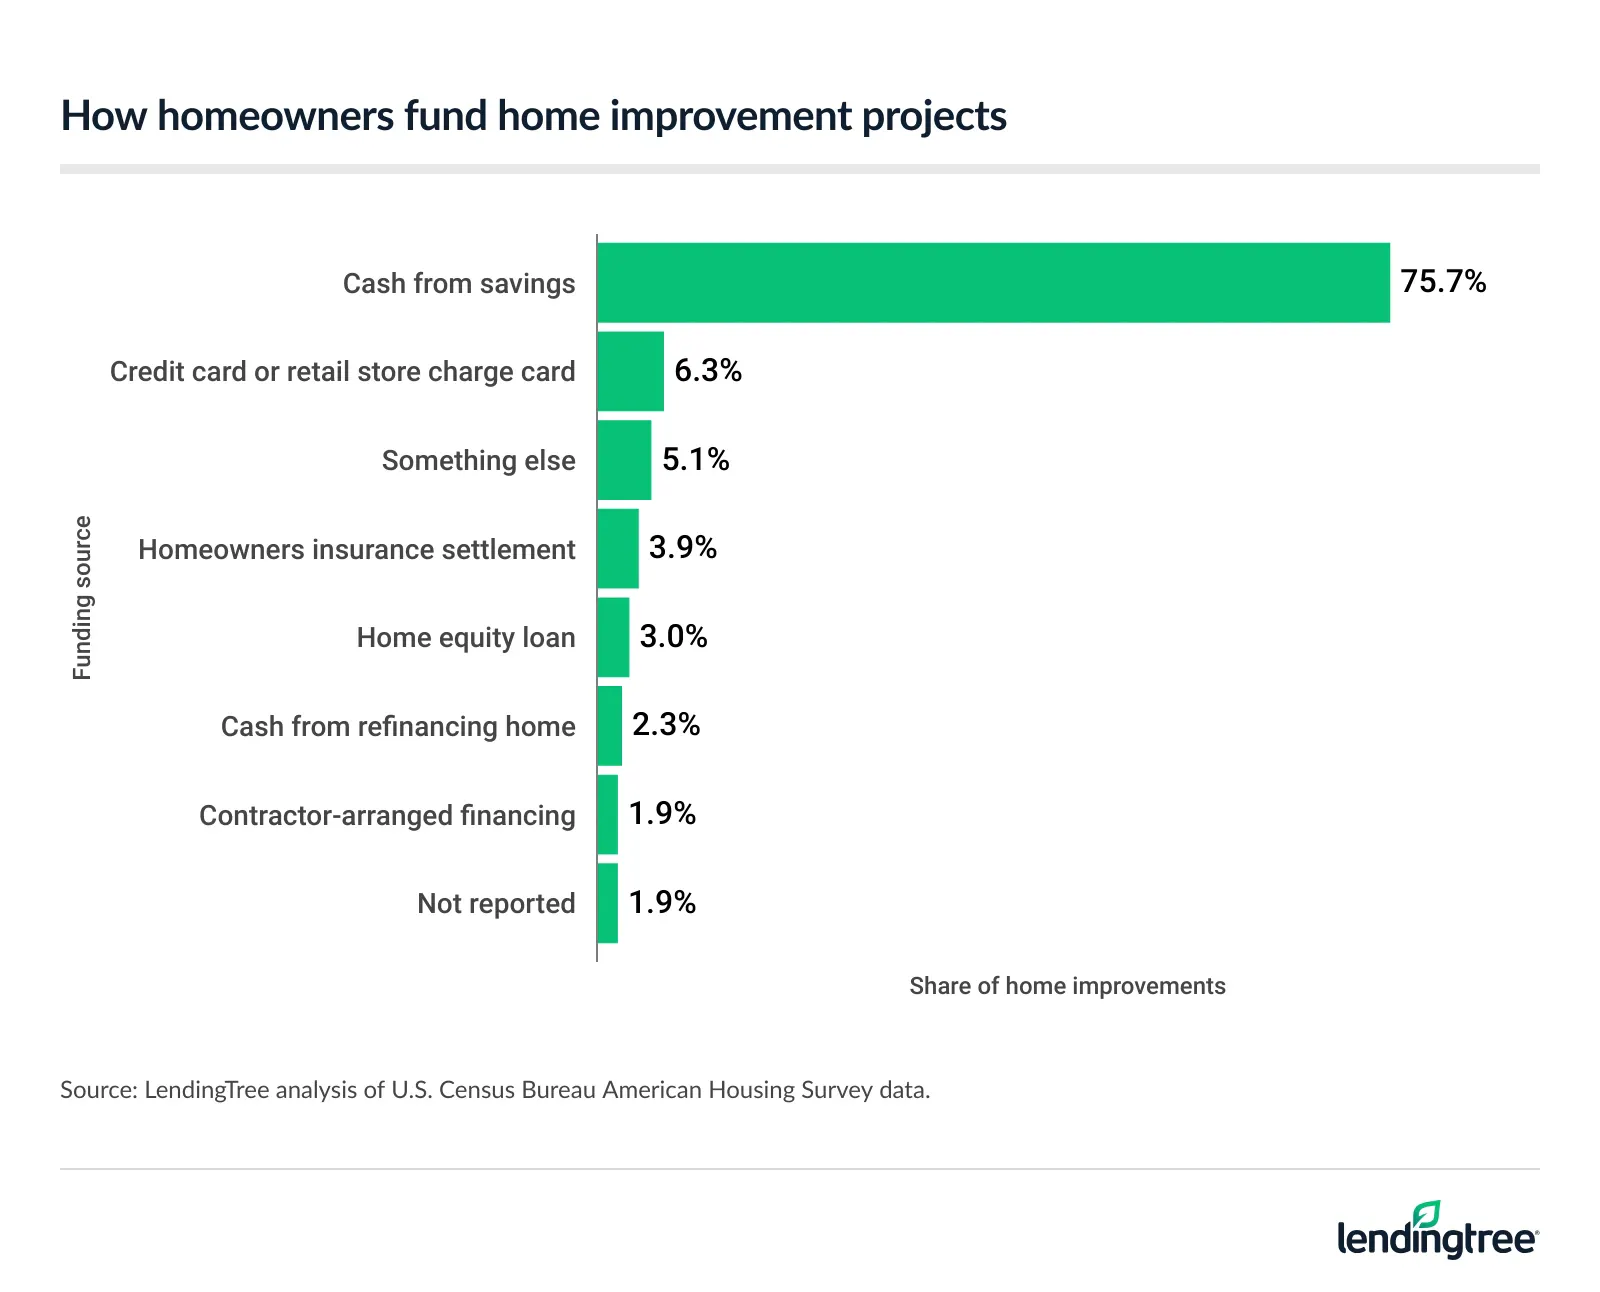
The difference in project costs helps explain why funding patterns vary. Savings commonly paid for smaller jobs, while insurance settlements and home equity loans were associated with higher median project costs. These figures describe how projects were funded; they don’t establish which option suits a particular household.
Schulz says using savings can avoid interest and prevent additional debt tied to the home, provided the expense doesn’t drain an emergency fund or displace other important goals. For a large, necessary project with a long useful life, he says, borrowing against home equity may be an option for households with strong equity, stable income and a clear repayment plan. The home serves as collateral, which makes the potential consequences of repayment trouble significant.
Home improvements by funding source and estimated costs
| Funding source | Project share | Estimated median ($) |
|---|---|---|
| Cash from savings | 75.7% | $1,902 |
| Credit card or retail store charge card | 6.3% | $2,113 |
| Something else | 5.1% | $4,226 |
| Homeowners insurance settlement | 3.9% | $9,963 |
| Home equity loan | 3.0% | $7,924 |
| Cash from refinancing home | 2.3% | $5,389 |
| Contractor-arranged financing | 1.9% | $7,924 |
| Not reported | 1.9% | $3,019 |
Source: LendingTree analysis of U.S. Census Bureau American Housing Survey and U.S. BLS data.
Planning for cost overruns and financing
Schulz recommends defining the scope of work clearly and collecting at least three itemized estimates. Detailed bids make it easier to compare what contractors include, and differences between estimates can inform discussions with a preferred contractor.
He also recommends setting aside a cushion for surprises, particularly in older homes, where hidden problems may add to the bill. A budget that leaves room for unexpected work can reduce the chance that a repair must go onto a credit card.
For households considering financing, the relevant comparison is not just the amount available. Schulz advises comparing home equity loans, credit cards, personal loans and other offers, while weighing whether repayment fits the household’s finances. The cost and terms of borrowing matter alongside the urgency and useful life of the project.
How the estimates were assembled
Researchers analyzed national estimates from the U.S. Census Bureau’s 2023 American Housing Survey. The main analysis covers owner-occupied housing units and improvement activity reported over the survey’s two-year reference period. Historical median project expenditures draw on the 2015, 2017, 2019, 2021 and 2023 surveys.
Amounts stated in 2025 dollars were calculated by multiplying the corresponding 2023 survey estimates by an inflation adjustment factor. That factor came from the average of available 2025 monthly observations in the U.S. Bureau of Labor Statistics Consumer Price Index for All Urban Consumers (CPI-U).
The data show that improvement costs, maintenance needs and financing choices vary with the home and the work involved. With project costs up sharply over the decade and older homes carrying higher estimated upkeep, planning for repairs has become a material part of household housing costs.