Young Firms Added 1.8 Million Jobs in 2025 as Established Businesses Contracted
Young firms added 1,801,511 net jobs in 2025, offsetting losses among established companies. The national gain was 636,626 jobs, with sharp differences by state and industry.

Newer firms carried U.S. job growth in 2025
U.S. private-sector employment grew by a net 636,626 jobs in 2025, but that headline gain conceals a sharp divide by firm age. Businesses less than five years old added 1,801,511 net jobs, while firms five years old or more lost 1,164,885. The figures suggest that younger firms were the main source of net job creation during the year, while losses among established businesses absorbed much of their contribution.

The contrast extends beyond a single year. From 2016 through 2025, young businesses added 18,832,631 net jobs. Older businesses recorded a net loss of 3,034,412 over the same period. The pattern is not uniform from year to year, though: older firms produced large gains in some years and steep losses in others. That volatility makes the ten-year comparison useful context, but it does not mean every young business grew or every established firm contracted.
The analysis uses U.S. Bureau of Labor Statistics Business Employment Dynamics data. It defines young businesses, also called startups, as firms less than five years old, combining firms under one year old with those one to four years old. Firms five years old or more are grouped as older businesses. Net job change is gross job gains minus gross job losses, and the 2025 figures measure employment changes from March 2024 to March 2025.
A modest total gain masks a wide age split
The private sector’s net gain of 636,626 jobs in 2025 was less than half the 1,448,270 recorded in 2024 and less than one-tenth of the 6,929,203 gained in 2022. The latter was the largest annual gain in the period examined. In 2025, growth among young firms more than covered losses among older ones, leaving a positive total. Without that contribution, the overall result would have been substantially weaker.

Looking at the age categories separately shows that nearly all the young-firm gain came from the newest group. Businesses less than one year old added 1,808,456 net jobs, while firms one to four years old lost 6,945. Among older firms, companies five to nine years old lost 199,435 jobs, and those ten years old or more lost 965,450. Net losses increased with age across these categories in 2025.
| Age of business | Net job change |
|---|---|
| Less than 1 year old | 1,808,456 |
| 1 to 4 years | -6,945 |
| 5 to 9 years | -199,435 |
| 10 years or older | -965,450 |
| All ages | 636,626 |
Source: LendingTree analysis of U.S. Bureau of Labor Statistics Business Employment Dynamics data.
The broader time series puts 2025 in perspective. Young businesses posted net gains in every year shown, generally ranging from about 1.5 million to 2.6 million. Their 2025 gain of 1,801,511 was close to the 1,829,319 recorded in 2024 and sits within the range seen in several earlier years. Older-business results moved more dramatically: a 4,319,099 gain in 2022 followed a loss of 6,974,660 in 2021. The overall total consequently swung from a loss of 5,478,688 in 2021 to a gain of 6,929,203 the following year.
| Year | Young-business net job change | Older-business net job change | Overall net job change |
|---|---|---|---|
| 2025 | 1,801,511 | -1,164,885 | 636,626 |
| 2024 | 1,829,319 | -381,049 | 1,448,270 |
| 2023 | 2,074,941 | 1,263,592 | 3,338,533 |
| 2022 | 2,610,104 | 4,319,099 | 6,929,203 |
| 2021 | 1,495,972 | -6,974,660 | -5,478,688 |
| 2020 | 1,629,113 | -1,262,143 | 366,970 |
| 2019 | 1,859,406 | -14,588 | 1,844,818 |
| 2018 | 1,819,587 | 348,646 | 2,168,233 |
| 2017 | 1,858,615 | 174,050 | 2,032,665 |
| 2016 | 1,854,063 | 657,526 | 2,511,589 |
| 2016-2025 | 18,832,631 | -3,034,412 | 15,798,219 |
Source: LendingTree analysis of U.S. Bureau of Labor Statistics Business Employment Dynamics data.
Young-firm gains reached every state, but totals varied
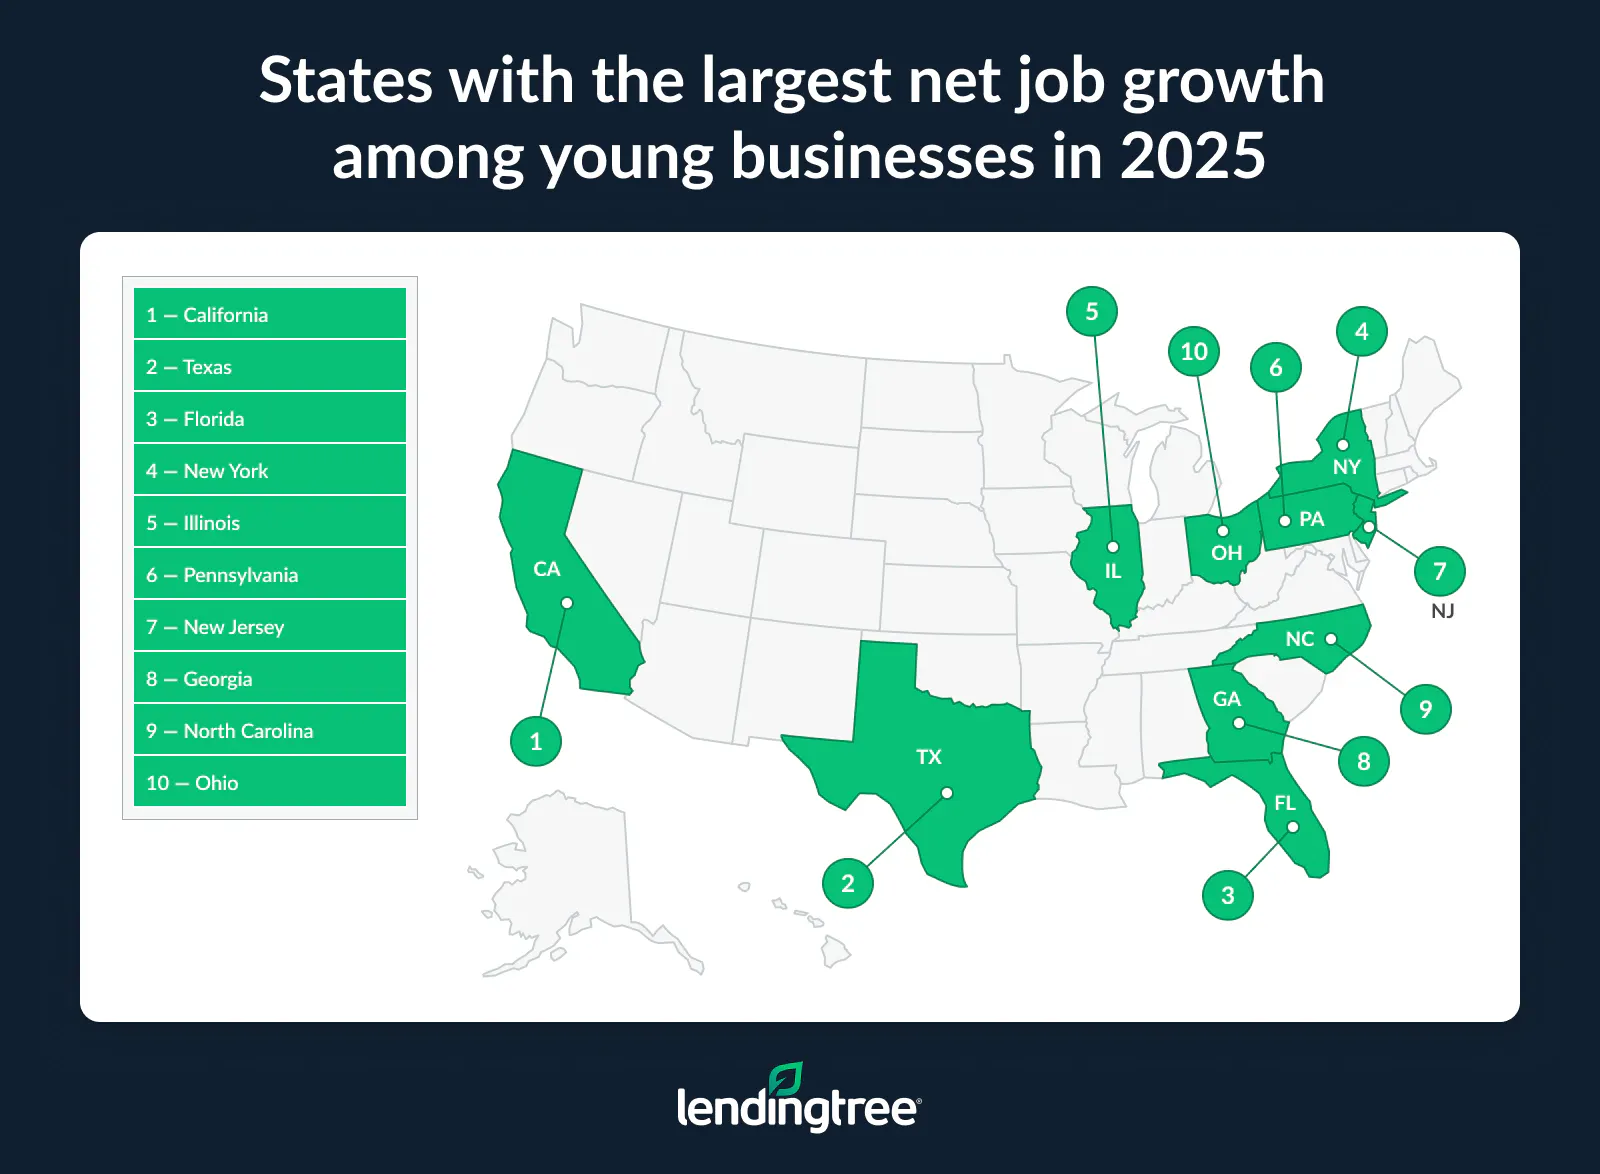
Every state and the District of Columbia recorded more job gains than losses among young businesses in 2025. The largest net additions were in California, at 256,940, followed by Texas with 177,423 and Florida with 153,448. New York ranked fourth at 122,807. These totals show where young firms made the largest net contribution; they do not, by themselves, describe the share of each state’s workforce represented by those jobs.
In 15 states, losses among older businesses outweighed young-firm gains, producing a net decline in private-sector jobs. California had the largest overall loss: its young businesses added 256,940 net jobs, but older businesses lost 305,534, leaving the state down 48,594. Massachusetts lost 22,710 overall, Michigan 21,547 and Oregon 20,847. Each of those totals was less than half California’s loss.
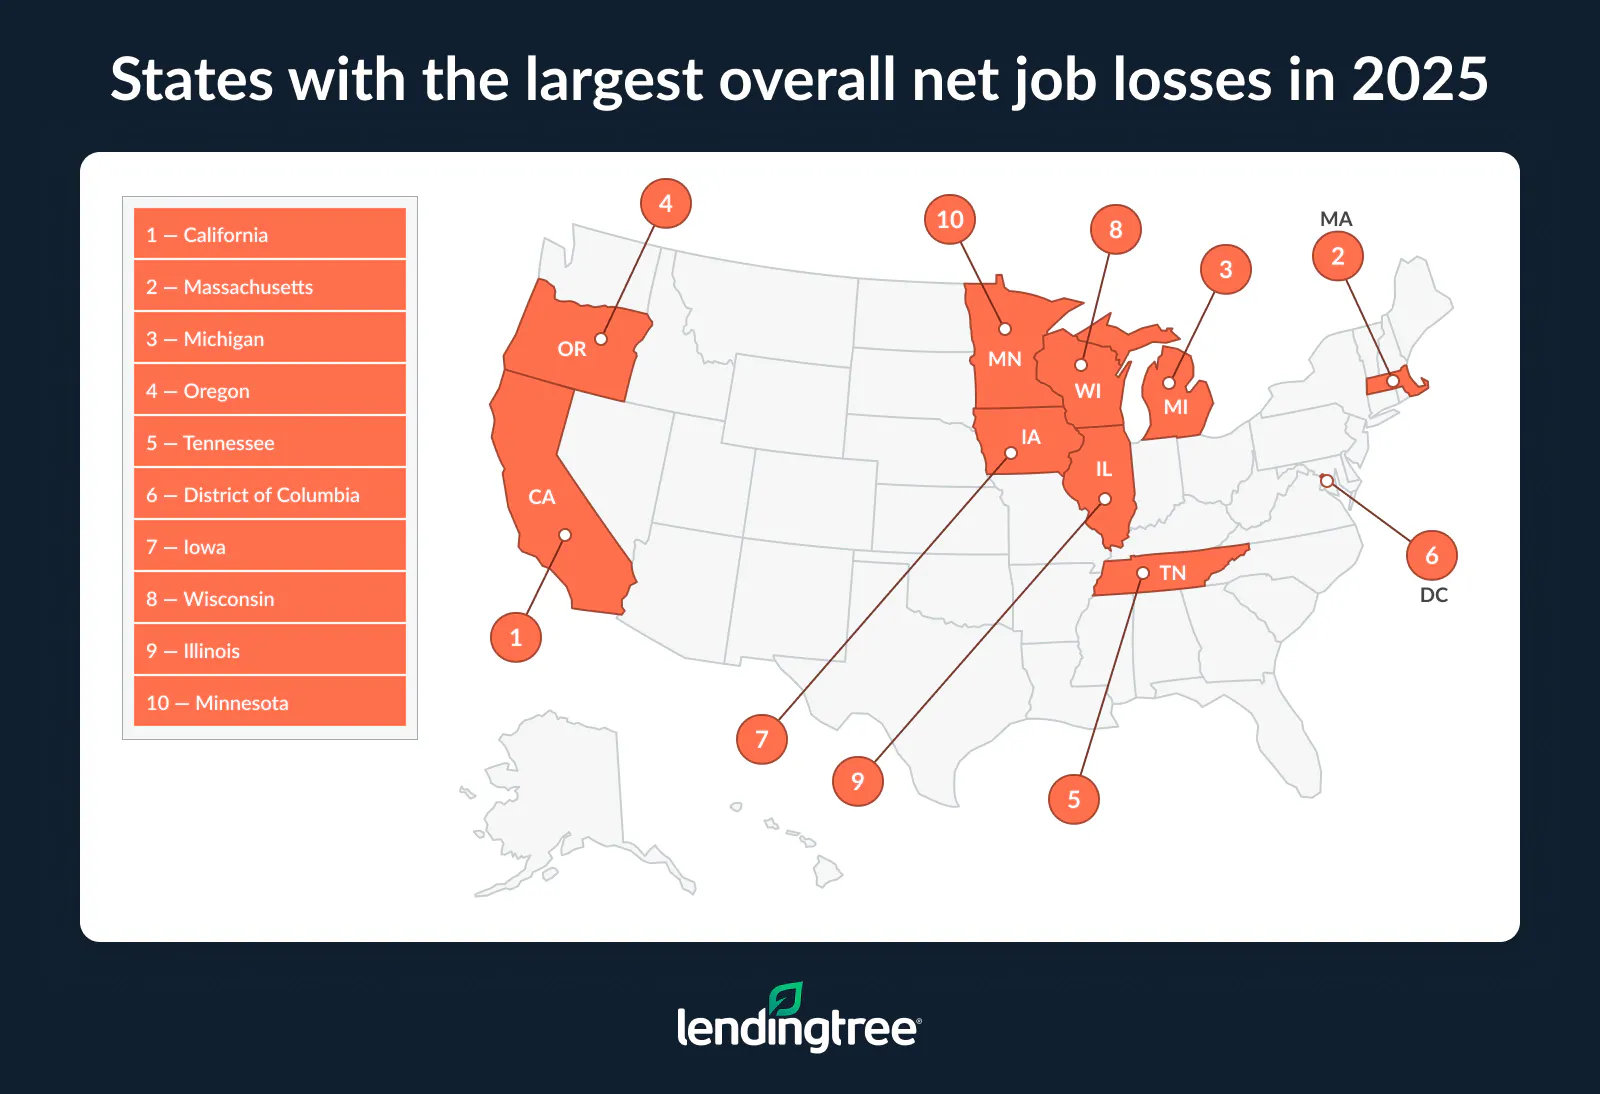
Older businesses added more jobs than they lost in only two states: New York, with a net gain of 65,931, and Alaska, with a gain of 1,151. New York therefore combined gains among both age groups for an overall increase of 188,738. The state examples make the national split concrete: strong startup gains did not guarantee overall growth where losses among established firms were larger.
| Rank | State | Young-business net job change | Older-business net job change | Overall net job change |
|---|---|---|---|---|
| 1 | California | 256,940 | -305,534 | -48,594 |
| 2 | Texas | 177,423 | -27,029 | 150,394 |
| 3 | Florida | 153,448 | -43,743 | 109,705 |
| 4 | New York | 122,807 | 65,931 | 188,738 |
| 5 | Illinois | 57,720 | -62,020 | -4,300 |
| 6 | Pennsylvania | 57,166 | -27,152 | 30,014 |
| 7 | New Jersey | 56,817 | -20,778 | 36,039 |
| 8 | Georgia | 56,607 | -47,160 | 9,447 |
| 9 | North Carolina | 51,619 | -39,913 | 11,706 |
| 10 | Ohio | 50,523 | -41,856 | 8,667 |
| 11 | Washington | 45,386 | -19,294 | 26,092 |
| 12 | Virginia | 44,728 | -16,860 | 27,868 |
| 13 | Michigan | 44,001 | -65,548 | -21,547 |
| 14 | Maryland | 40,421 | -12,312 | 28,109 |
| 15 | Arizona | 39,949 | -20,913 | 19,036 |
| 16 | Colorado | 34,481 | -34,185 | 296 |
| 17 | South Carolina | 33,956 | -1,995 | 31,961 |
| 18 | Tennessee | 32,390 | -43,668 | -11,278 |
| 19 | Massachusetts | 30,817 | -53,527 | -22,710 |
| 20 | Missouri | 29,874 | -28,130 | 1,744 |
| 21 | Indiana | 26,407 | -19,089 | 7,318 |
| 22 | Minnesota | 26,140 | -28,975 | -2,835 |
| 23 | Utah | 23,774 | -8,341 | 15,433 |
| 24 | Alabama | 22,969 | -20,180 | 2,789 |
| 25 | Wisconsin | 21,662 | -26,509 | -4,847 |
| 26 | Kentucky | 21,456 | -22,969 | -1,513 |
| 27 | Oklahoma | 19,795 | -12,266 | 7,529 |
| 28 | Louisiana | 19,744 | -9,034 | 10,710 |
| 29 | Connecticut | 19,261 | -10,529 | 8,732 |
| 30 | Nevada | 17,704 | -12,965 | 4,739 |
| 31 | Oregon | 16,991 | -37,838 | -20,847 |
| 32 | Iowa | 13,246 | -21,202 | -7,956 |
| 33 | Idaho | 13,196 | -3,784 | 9,412 |
| 34 | Arkansas | 13,167 | -2,871 | 10,296 |
| 35 | Mississippi | 12,696 | -14,687 | -1,991 |
| 36 | Nebraska | 11,240 | -12,540 | -1,300 |
| 37 | Kansas | 11,001 | -1,002 | 9,999 |
| 38 | New Mexico | 9,578 | -6,938 | 2,640 |
| 39 | Maine | 6,945 | -4,039 | 2,906 |
| 40 | Montana | 6,410 | -3,296 | 3,114 |
| 41 | West Virginia | 6,018 | -1,966 | 4,052 |
| 42 | Rhode Island | 5,804 | -176 | 5,628 |
| 43 | Delaware | 5,687 | -3,029 | 2,658 |
| 44 | New Hampshire | 5,681 | -5,236 | 445 |
| 45 | Hawaii | 5,546 | -3,181 | 2,365 |
| 46 | District of Columbia | 4,754 | -13,959 | -9,205 |
| 47 | North Dakota | 4,417 | -3,392 | 1,025 |
| 48 | South Dakota | 4,363 | -3,405 | 958 |
| 49 | Alaska | 3,215 | 1,151 | 4,366 |
| 50 | Wyoming | 2,831 | -2,928 | -97 |
| 51 | Vermont | 2,740 | -4,024 | -1,284 |
Source: LendingTree analysis of U.S. Bureau of Labor Statistics Business Employment Dynamics data. Rankings are based on young-business net job change.
Two industries accounted for much of young-firm growth
Across the 11 industries examined, education and health services led total job creation in 2025, with 810,309 net jobs added. Transportation and warehousing followed with 126,229. Construction added 90,151 and financial activities 17,349. Those were the only four industries with net growth across businesses of all ages.
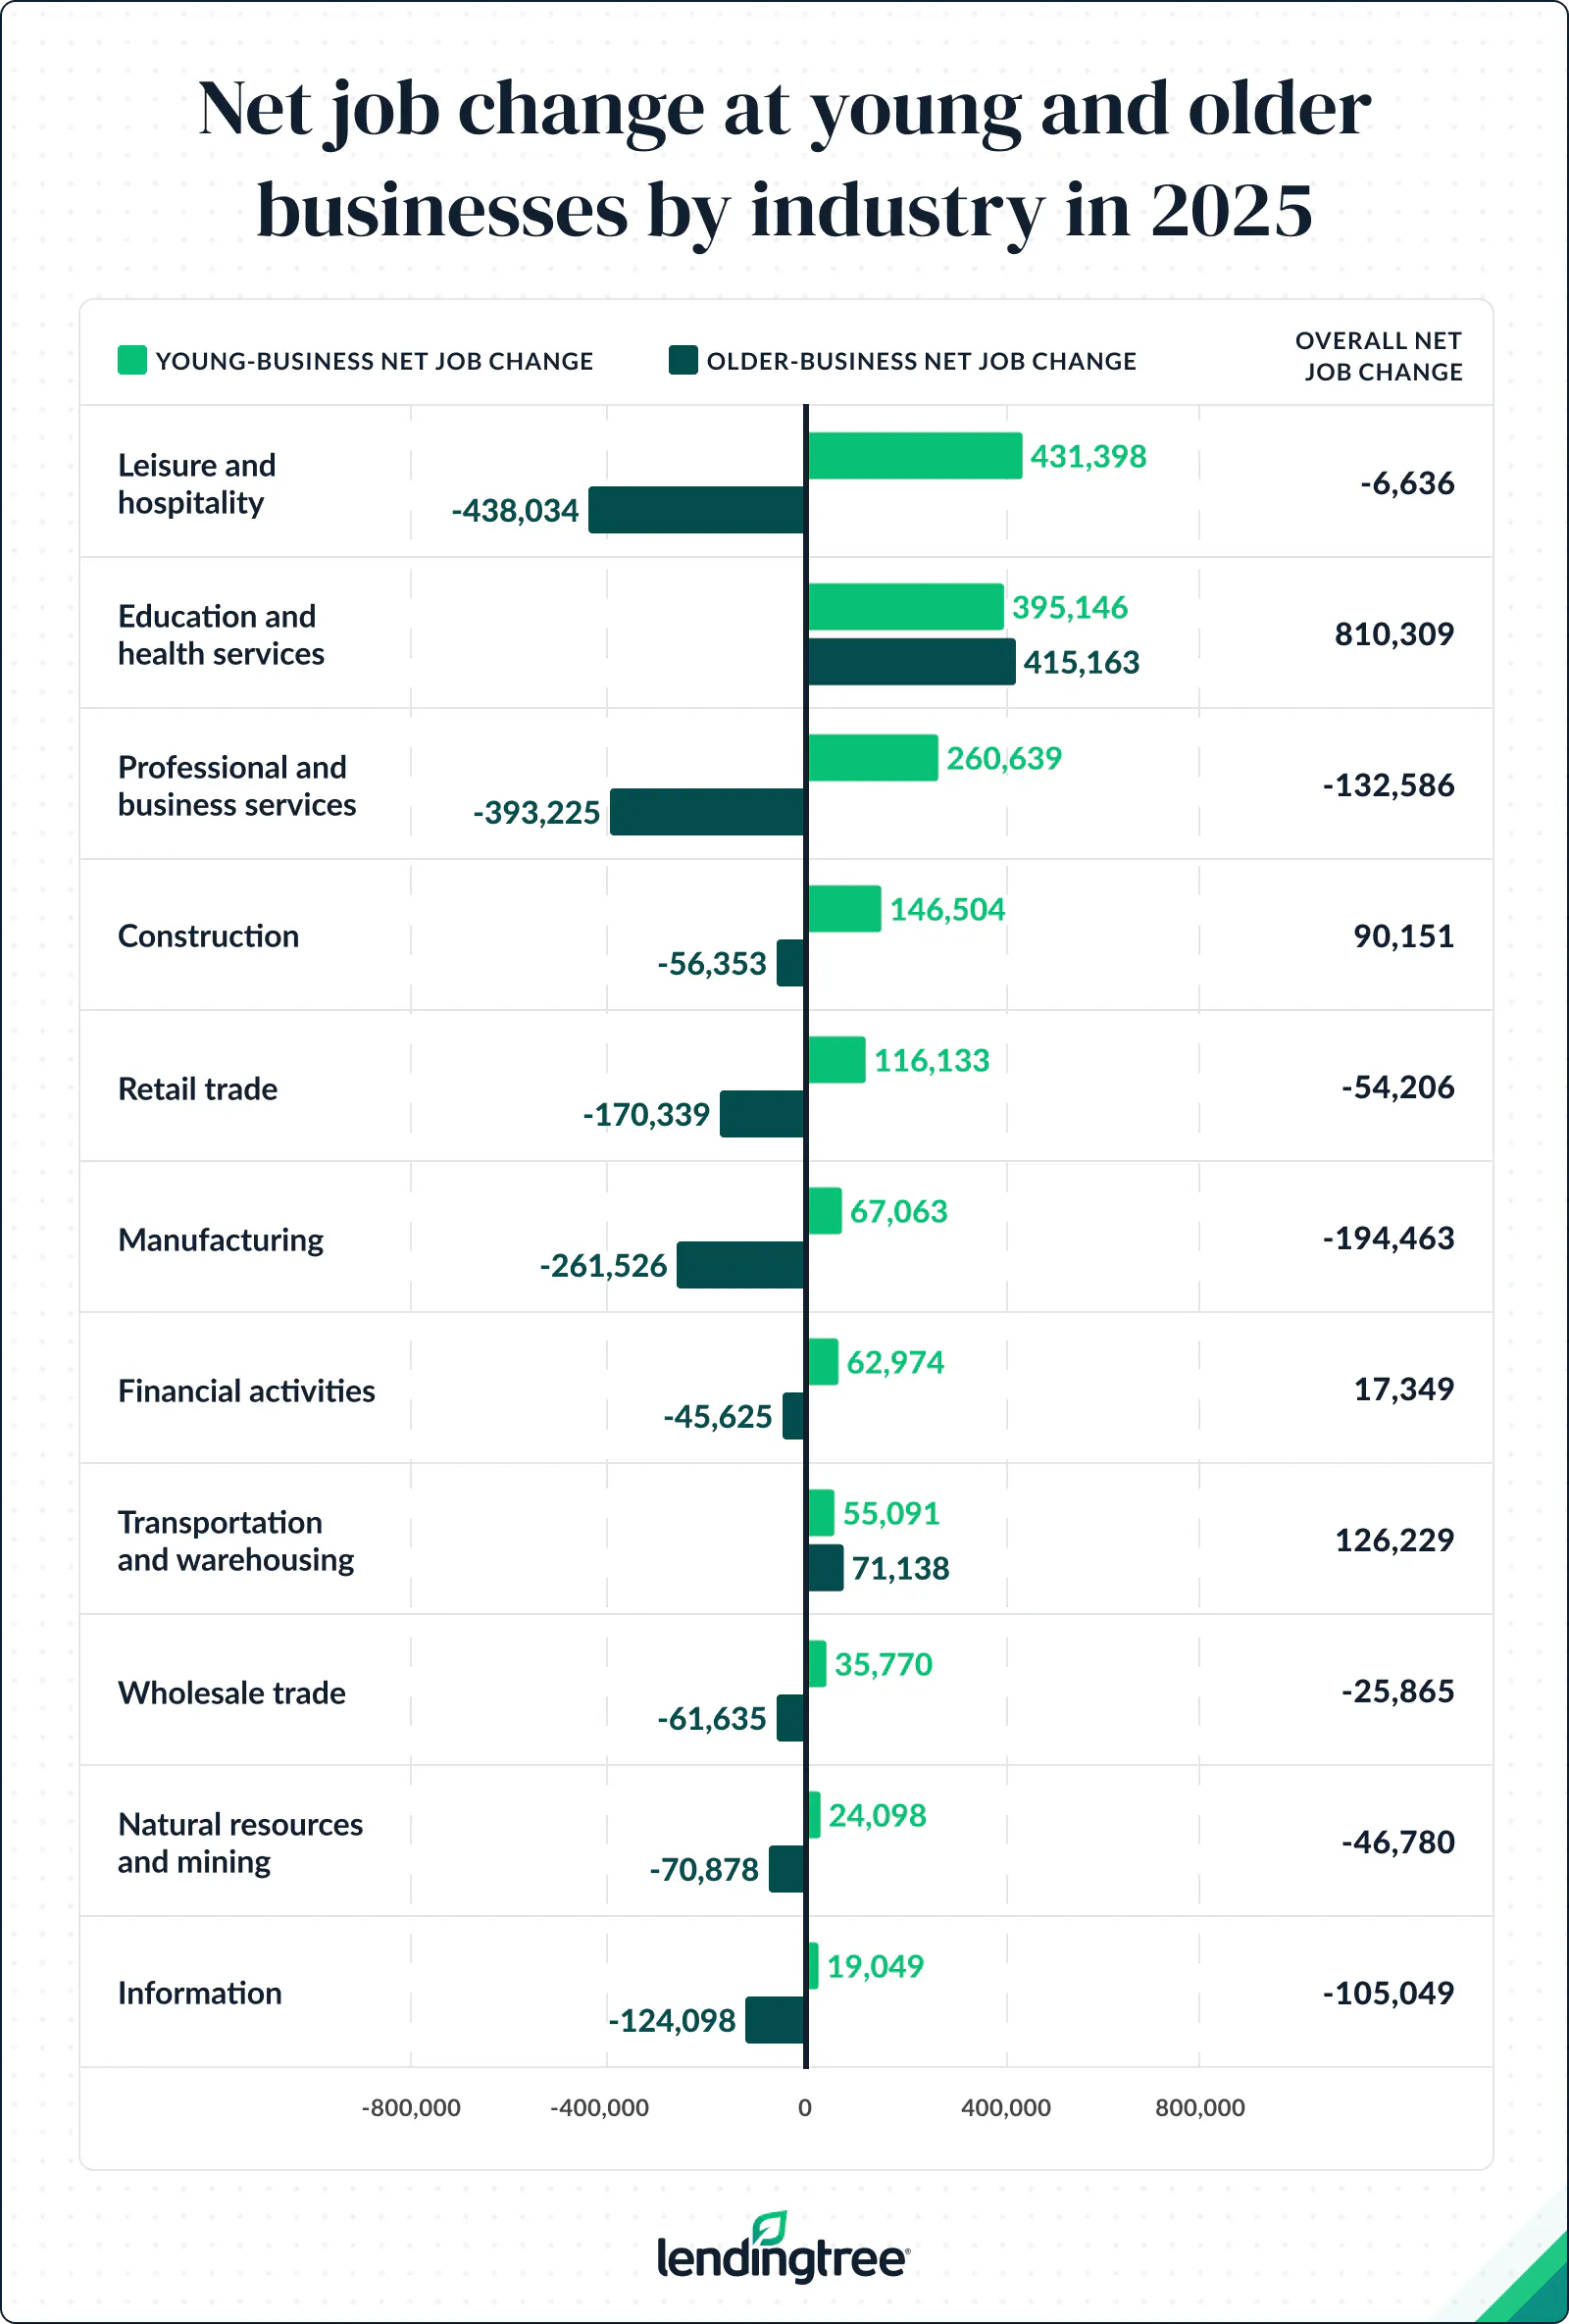
The picture among older firms was narrower: they recorded net job gains in only education and health services, up 415,163, and transportation and warehousing, up 71,138. Every other industry saw net losses among older businesses. Losses ranged from 45,625 in financial activities to 438,034 in leisure and hospitality.
Young businesses, by contrast, added net jobs in all 11 industries. Leisure and hospitality led with 431,398, followed by education and health services at 395,146. Three more sectors each gained over 100,000: professional and business services (260,639), construction (146,504) and retail trade (116,133). This concentration means the young-firm contribution was broad by industry, but weighted heavily toward a small number of sectors.
At the state level, leisure and hospitality was the leading source of young-business job growth in 25 states and the District of Columbia; education and health services led in 24 states. Utah was the sole state where professional and business services topped the list. Some industry-level values were withheld in the underlying data for confidentiality, so in those states the leading industry shown is the top result among industries with published figures.
| State | Leading industry for young-business net jobs |
|---|---|
| Alabama | Leisure and hospitality |
| Alaska | Education and health services |
| Arizona | Education and health services |
| Arkansas | Leisure and hospitality |
| California | Leisure and hospitality |
| Colorado | Education and health services |
| Connecticut | Education and health services |
| Delaware | Education and health services |
| District of Columbia | Leisure and hospitality |
| Florida | Leisure and hospitality |
| Georgia | Leisure and hospitality |
| Hawaii | Leisure and hospitality |
| Idaho | Education and health services |
| Illinois | Leisure and hospitality |
| Indiana | Leisure and hospitality |
| Iowa | Leisure and hospitality |
| Kansas | Leisure and hospitality |
| Kentucky | Education and health services |
| Louisiana | Leisure and hospitality |
| Maine | Education and health services |
| Maryland | Leisure and hospitality |
| Massachusetts | Leisure and hospitality |
| Michigan | Leisure and hospitality |
| Minnesota | Education and health services |
| Mississippi | Leisure and hospitality |
| Missouri | Education and health services |
| Montana | Education and health services |
| Nebraska | Education and health services |
| Nevada | Education and health services |
| New Hampshire | Leisure and hospitality |
| New Jersey | Education and health services |
| New Mexico | Education and health services |
| New York | Leisure and hospitality |
| North Carolina | Leisure and hospitality |
| North Dakota | Education and health services |
| Ohio | Education and health services |
| Oklahoma | Leisure and hospitality |
| Oregon | Education and health services |
| Pennsylvania | Education and health services |
| Rhode Island | Education and health services |
| South Carolina | Education and health services |
| South Dakota | Leisure and hospitality |
| Tennessee | Leisure and hospitality |
| Texas | Leisure and hospitality |
| Utah | Professional and business services |
| Vermont | Leisure and hospitality |
| Virginia | Education and health services |
| Washington | Leisure and hospitality |
| West Virginia | Education and health services |
| Wisconsin | Education and health services |
| Wyoming | Leisure and hospitality |
Source: LendingTree analysis of U.S. Bureau of Labor Statistics Business Employment Dynamics data. In states with withheld industry figures, the listed sector has the largest gain among industries with published data.
What hiring figures can and cannot tell a business
The employment totals describe net changes across firms, not an outlook for any particular company. For a small business weighing a new hire, the source offers practical considerations: calculate the full cost of employment, assess whether cash flow can support payroll during a slower period, and identify whether permanent staff are the right response to added workload.
Salary is only one component of the expense. Payroll taxes, benefits, insurance, equipment and training can add to the cost. A business can show a profit on paper while still facing pressure if customers pay slowly or revenue varies. Estimating how the added expense fits into cash flow can help owners judge whether hiring is manageable through a weaker month or quarter.
Extra demand also does not automatically require a permanent role. Depending on the work, overtime, a contractor, automation or a process change may help address the workload. Where demand appears sustained and the responsibilities call for an ongoing position, a new employee may be a better fit. The decision depends on the expected workload and the business’s ability to carry the costs, not just how busy it is today.
The 2025 data point to a clear source of aggregate job growth: firms under five years old. They also show how differently that growth landed across age groups, states and industries. Whether the pattern persists will depend on future hiring and contraction among both newer and established businesses; the 2025 figures alone cannot settle that question.