US Wage Growth Diverges: Broadcasting Pay Rises 16.8% as Healthcare Adds the Most Jobs
Broadcasting wages climbed 16.8% in 2025, while healthcare and social assistance led hiring with 763,478 jobs added.

US private-sector wage and hiring gains split sharply by industry in 2025. Average weekly wages rose 4.2% across private-sector industries, but broadcasting and content providers recorded a 16.8% increase. Hiring followed a different pattern: healthcare and social assistance added 763,478 jobs, while employment in the information sector fell 1.9%.

That divide matters for employers and workers. Fast wage growth can signal strong competition for skills, yet it doesn’t guarantee that an industry is expanding its workforce. Healthcare’s hiring lead, by contrast, reflects a broad rise across its subsectors. The data point to uneven labor demand, with pay pressure concentrated in some industries and job creation in others.
Information subsectors top the wage rankings
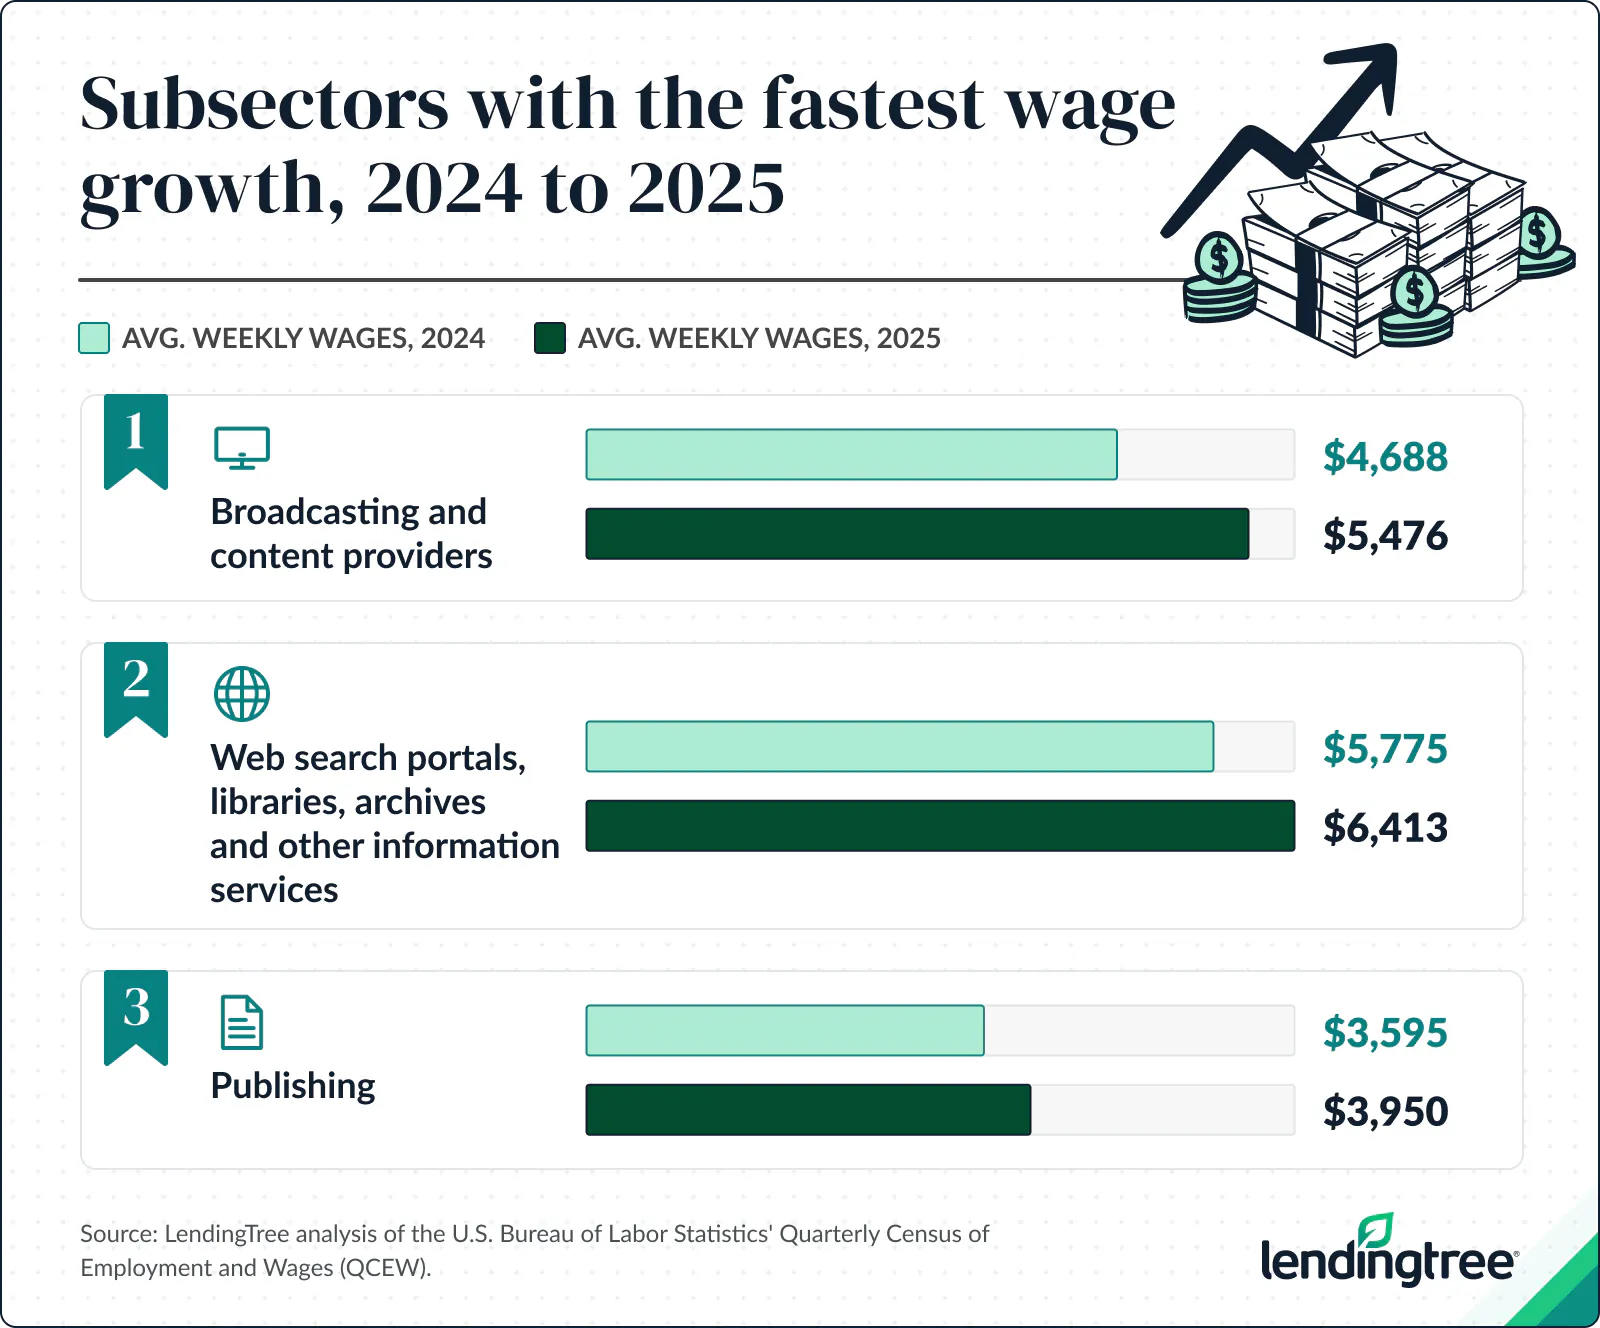
Broadcasting and content providers had the largest average weekly wage increase among the 74 qualifying subsectors. Average pay moved from $4,688 in 2024 to $5,476 in 2025, a gain of $788, or 16.8%. That increase was well above the 4.2% private-sector average, which equaled $62 per week.
Two other information industries also ranked near the top. Web search portals, libraries, archives and other information services saw average weekly wages rise 11.0%, or $638, to $6,413. Publishing industries recorded a 9.9% gain, or $355, bringing average weekly wages to $3,950. Together with broadcasting, those industries helped make information the most prominent source of large wage increases: five of the 10 fastest-growing subsectors by pay were in the information sector.
The top 10 also included industries outside information. Securities, commodity contracts and other financial investments and related activities posted an 8.8% increase, with average weekly wages rising from $5,533 to $6,020. Computer and electronic product manufacturing rose 7.2%, to $3,161. Credit intermediation and related activities increased 7.1%, to $2,365.
Transportation equipment manufacturing recorded a 6.3% gain, telecommunications rose 6.0%, and computing infrastructure providers, data processing, web hosting and related services advanced 5.7%. Professional, scientific and technical services rounded out the top 10 with a 5.6% increase.
The wage table also underscores the difference between percentage growth and pay levels. Web search portals and related services had the highest 2025 average weekly wage among the top 10, at $6,413, followed by securities and related financial activities at $6,020 and broadcasting at $5,476. A large percentage increase can reflect the pace of change; it doesn’t tell the whole story about an industry’s starting point or workforce size.

At the other end of the ranking, motion picture and sound recording industries were the only subsector with a decline in average weekly wages. Pay fell 2.0%, or $36, from $1,764 in 2024 to $1,728 in 2025. Transit and ground passenger transportation had the smallest positive change, increasing 0.3%, or $3, to $998.
Matt Schulz, LendingTree’s chief consumer finance analyst and author of “Ask Questions, Save Money, Make More: How to Take Control of Your Financial Life,” said the rapid gains in some fields suggest substantial employer demand for talent. That demand can put smaller firms under pressure when they compete with larger companies that have more room to raise salaries.
Schulz said smaller employers may need to make other parts of a job more attractive, including flexibility and opportunities to advance. Pay remains a major factor in where people choose to work, he said, but it is not the only consideration. The figures don’t identify the specific occupations or skills behind each industry’s average, so they show where wage growth was strongest rather than which workers received the largest raises.
Healthcare leads private-sector hiring
Employment growth was concentrated in healthcare and social assistance. Annual average employment in the sector increased 3.4% from 2024 to 2025, reaching 22,981,116 from 22,217,638. The gain of 763,478 workers dwarfed the 0.4% increase across private-sector industries.
Healthcare’s scale is part of the story: it employed nearly 23 million people on an annual average basis in 2025. Its 3.4% growth rate also stood well above the next fastest-growing broad sectors in the analysis. Arts, entertainment and recreation employment rose 2.4%, while utilities increased 2.2%.
Construction employment grew 1.4%, educational services rose 1.3%, and transportation and warehousing advanced 0.9%. Finance and insurance increased 0.4%. Accommodation and food services, real estate and rental and leasing, and other services each posted 0.1% growth.
Gains were far from universal. Nine of the 20 broad sectors recorded lower annual average employment in 2025 than in 2024. Mining, quarrying and oil and gas extraction had the steepest decline, down 2.6%. Information and agriculture, forestry, fishing and hunting each fell 1.9%.
Other declines included manufacturing, down 1.2%; wholesale trade and administrative and support services, both down 1.1%; and retail trade, down 0.6%. Professional, scientific and technical services decreased 0.4%, while management of companies and enterprises fell 0.3%.
Schulz linked healthcare’s continued hiring to an aging population and the persistent need for care. Demand for healthcare services can be steadier than demand for many discretionary goods and services, he said, making the field appealing to workers seeking predictable employment. That competition can affect employers elsewhere that are trying to recruit and retain staff.
Social assistance adds the most workers
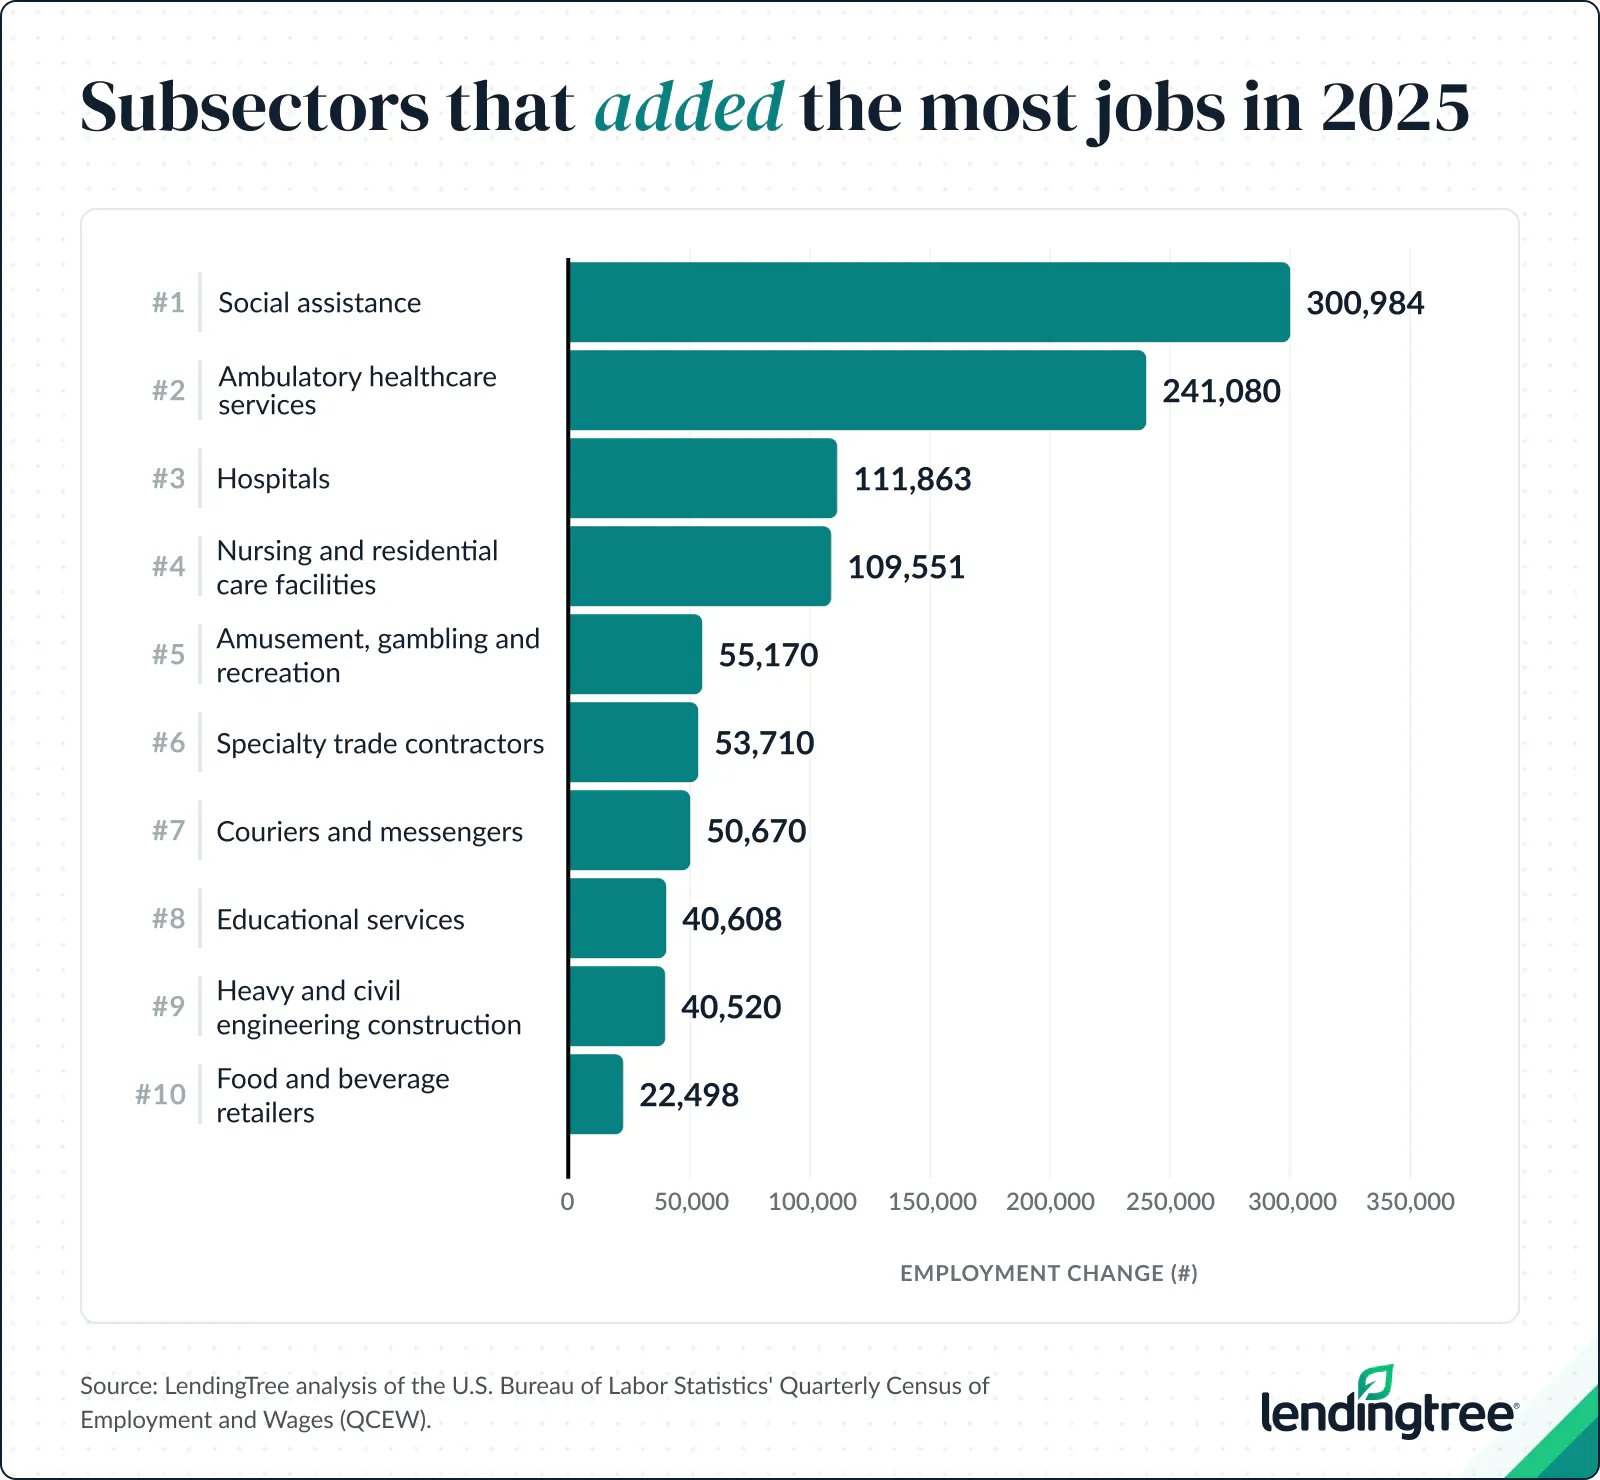
Within healthcare and social assistance, social assistance had the largest employment increase by both percentage and headcount. Annual average employment climbed 6.4%, from 4,679,485 to 4,980,469, adding 300,984 workers. No other qualifying subsector added as many jobs.
Ambulatory healthcare services ranked second by number of jobs added, with employment rising by 241,080 to 9,011,894, a 2.7% increase. Hospitals added 111,863 workers, up 2.1% to 5,566,376. Nursing and residential care facilities gained 109,551 workers, a 3.3% increase to 3,422,377.
These four subsectors accounted for the largest job gains in the ranking. Their combined growth shows how much of the year’s hiring momentum came from healthcare and related services. The increases also differed in pace: social assistance grew faster than the much larger ambulatory healthcare workforce, while nursing and residential care added a similar number of workers to hospitals at a higher percentage rate.
Schulz said an aging population may increase pressure on healthcare providers while creating opportunities for smaller firms that support the sector. He pointed to staffing, payroll, cybersecurity and cleaning as examples of services healthcare organizations may need. Those needs can extend the economic effect of healthcare hiring beyond providers themselves, though the source data measure employment by industry and do not quantify demand for particular support services.
Outside healthcare, the largest headcount gains among subsectors were notably smaller. Amusement, gambling and recreation industries added 55,170 workers, specialty trade contractors added 53,710, and couriers and messengers added 50,670. Educational services gained 40,608, and heavy and civil engineering construction added 40,520.
The 10 subsectors with the largest job gains added roughly 1.03 million workers in total. Subsections outside healthcare accounted for 25.6% of that combined increase. This concentration makes the overall hiring picture less broad than the headline job additions alone might suggest.
Growth rates tell a different story from job totals
Rankings by percentage growth highlight smaller and faster-growing workforces alongside large employers. Social assistance led at 6.4%, followed by couriers and messengers at 4.7% and transit and ground passenger transportation at 3.8%. Heavy and civil engineering construction grew 3.5%, and nursing and residential care facilities increased 3.3%.
Amusement, gambling and recreation industries and electrical equipment, appliance and component manufacturing each rose 3.0%. Ambulatory healthcare services grew 2.7%, utilities increased 2.2%, and hospitals advanced 2.1%. These rates compare employment with each subsector’s own prior-year base; the ranking by headcount instead favors industries with larger workforces.
At the bottom of the percentage ranking, wholesale trade agents and brokers fell 9.6%, from 491,730 to 444,769 workers. Motion picture and sound recording industries declined 4.3%, and telecommunications decreased 4.0%. Oil and gas extraction fell 3.8%, while furniture, home furnishings, electronics and appliance retailers were down 3.6%.
In total, 41 of the 74 subsectors analyzed reported lower employment in 2025. Several industries with strong wage gains also had fewer workers. Broadcasting and content providers, for example, added $788 to average weekly wages while employment declined by 5,150, or 1.5%. Publishing wages rose 9.9% as employment fell by 5,635, or 0.6%. Web search portals and related information services saw wages increase 11.0% while employment declined by 4,787, or 2.6%.
Those paired movements are a reminder that industry wage averages and job counts describe different parts of the labor market. Wages can rise even as employment contracts, and hiring can expand in industries where average pay grows more slowly. The figures don’t establish why each industry moved as it did, but they show that rapid pay growth alone is not evidence of broad workforce expansion.
Few subsectors outperform on both measures
Only six qualifying subsectors exceeded the private-industry average in both employment growth and wage growth: electrical equipment, appliance and component manufacturing; utilities; securities, commodity contracts and other financial investments and related activities; specialty trade contractors; animal production and aquaculture; and construction of buildings.
This overlap is narrow relative to the 74 subsectors included. It identifies industries where average wages and employment both grew faster than their respective private-sector benchmarks, but it does not show whether those gains were evenly distributed among employers, locations or occupations.
For small businesses facing wage competition, Schulz’s advice focused on employee retention and the wider employment offer. He recommended asking current employees what keeps them at the company, with flexibility, advancement opportunities and a sense of being heard among the factors that can matter. He also said a raise or bonus may cost less than replacing an experienced worker and training a new one.
He suggested that businesses regularly review staffing, benefits and operating costs to balance their ability to compete for workers with the need to protect margins. The data offer no single hiring strategy for every sector, but they show why employers may face very different pressures: wage growth was strongest in selected information industries, while most net job creation came from healthcare and social assistance.
How the analysis was assembled
LendingTree analyzed annual average employment and average weekly wage data from the U.S. Bureau of Labor Statistics’ Quarterly Census of Employment and Wages (QCEW), retrieved Aug. 4, 2026. The comparison covers 2024 and 2025 averages for US private-sector industries.
The analysis includes two-digit NAICS sectors and three-digit NAICS subsectors with at least 100,000 annual average employees in 2025. That cutoff was used to limit distortions from very small industries. Wage rankings are based on the unrounded percentage change in average weekly wages; the displayed percentages are rounded to one decimal place. Employment rankings likewise use unrounded changes, with some tables ordered by the number of jobs gained or lost and others by percentage change.
The figures are annual averages, so they summarize the year rather than a single month or a current hiring pace. They also report industry-level averages, not individual wage changes. Within those limits, the clearest signal is the split between pay and staffing: information subsectors led wage growth, while healthcare and social assistance drove the expansion in private-sector employment.